< Work
OrthoFi Dashboard Redesign
How might we simplify workflows and improve task efficiency for orthodontic practices?
The OrthoFi Dashboard is a key feature in a B2B SaaS platform that supports orthodontic practices in managing patient care, from insurance, patient forms, to treatment planning. The dashboard is mission-critical: it powers exam prep, task management, and follow-up across multiple roles. Yet, after a decade of use, the original experience had become a barrier to adoption, efficiency, and innovation.
With legacy spaghetti code and poor UX hierarchy, it required extensive training to use and was difficult to iterate on. I led a redesign of the dashboard experience, starting with understanding existing problem areas, mapping the existing functionality, and extensive user testing to create a more simplified dashboard experience.
Tools
Prototyping - Invision
High Fidelity Mockups - Sketch
Testing - Qualitative Interviews, A/B Test
Team
Lead Designer & Researcher - Alexandria Williams (Me)
Product Manager (1)
Engineering Manager (1)
Engineers (3)
The Problem Area
User Pain Points
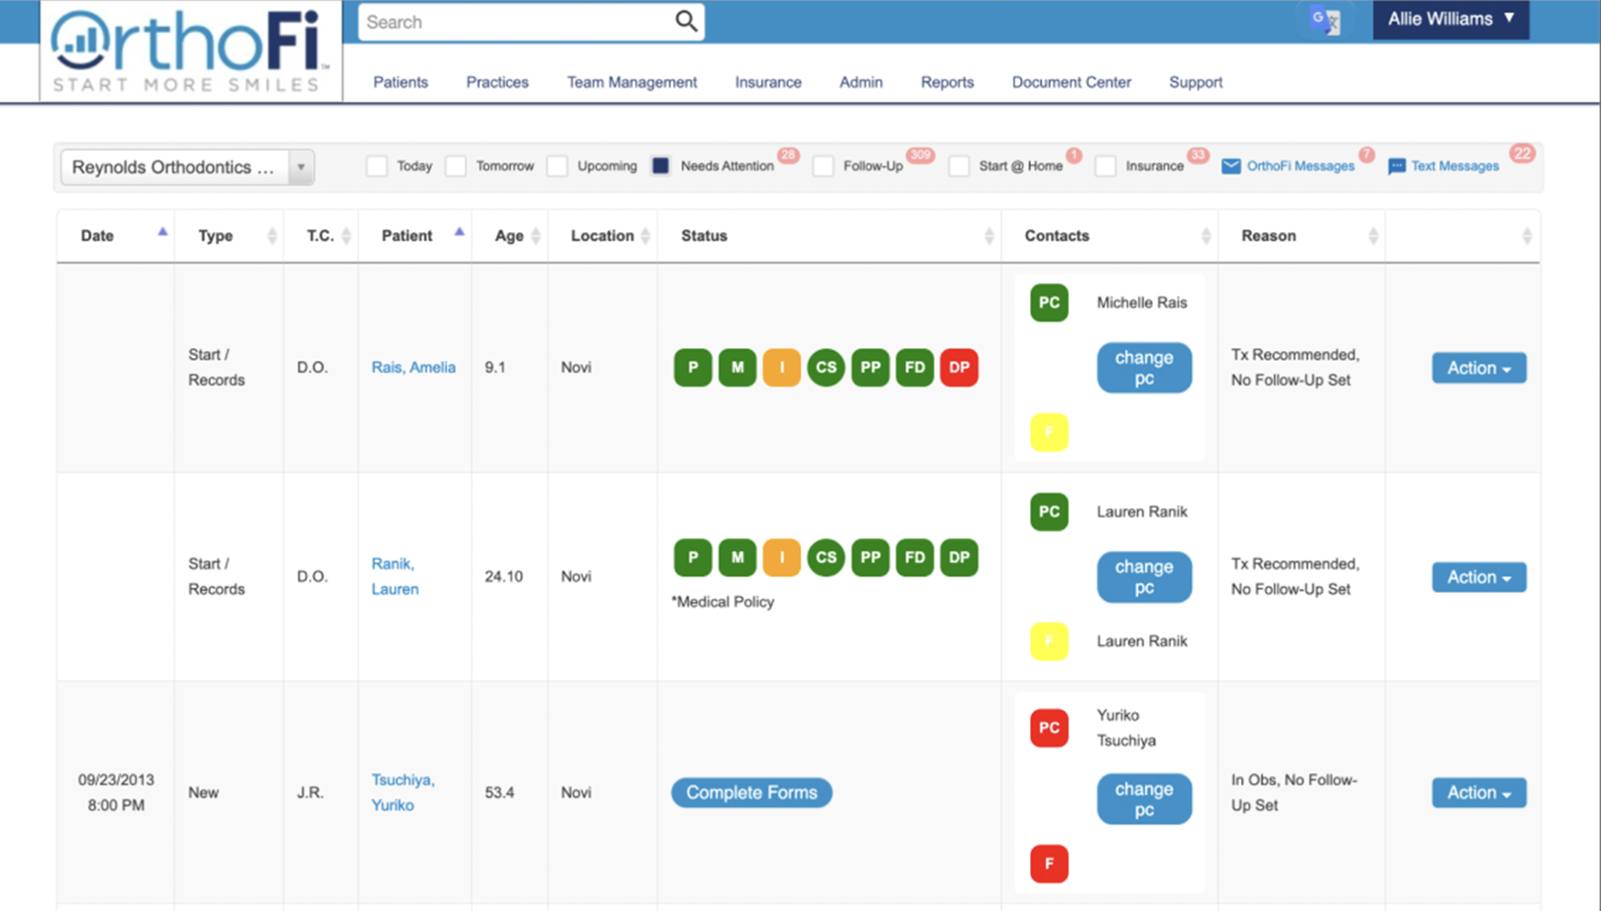
Based on user feedback collected over time and through various channels across the org, we knew the OrthoFi Dashboard had the following issues:
Poor visual hierarchy and unclear CTAs
Difficult to onboard new users
Basic tasks took a long time and required extensive training
Reliance on color to convey information
Lack of consistency across workflows
Technical Challenges
The dashboard was built on a 10+ year-old codebase, which had become a major barrier to both design evolution and development velocity. As the primary landing page of the application, its outdated architecture made it difficult to iterate, extend functionality, or introduce modern UX improvements. A redesign was necessary not just for the user experience, but to enable faster, more efficient development moving forward.
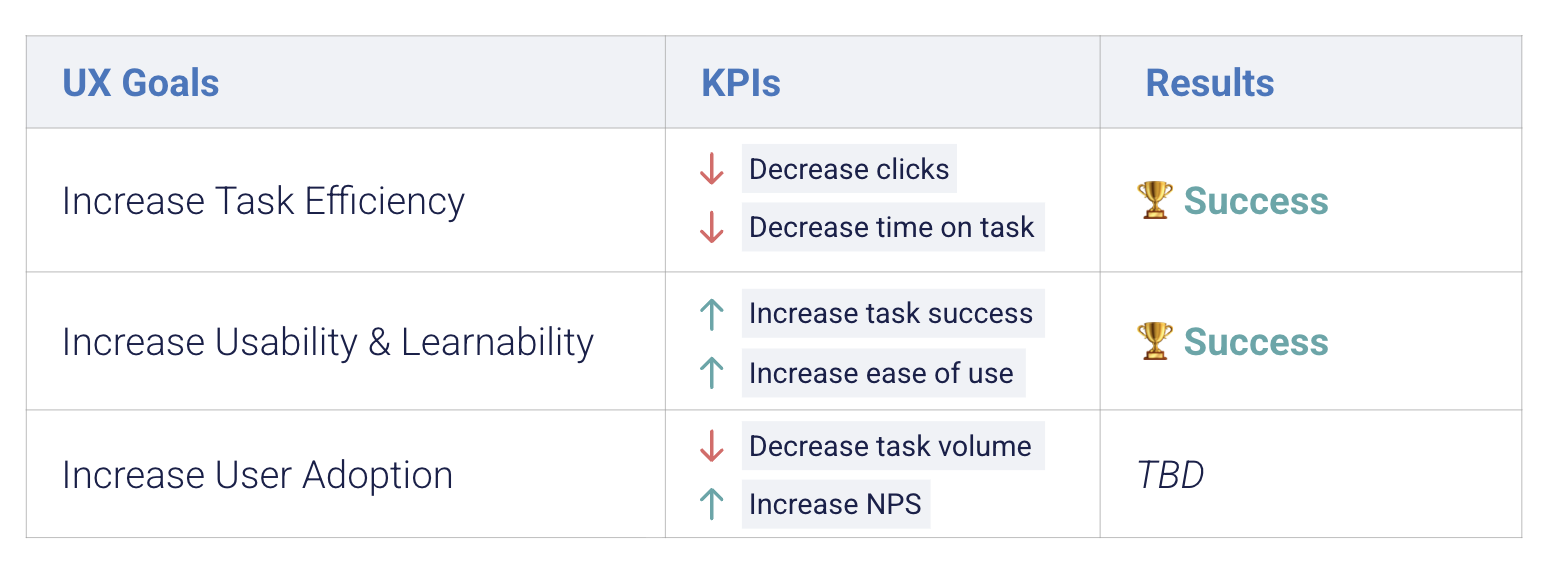
Defining Success
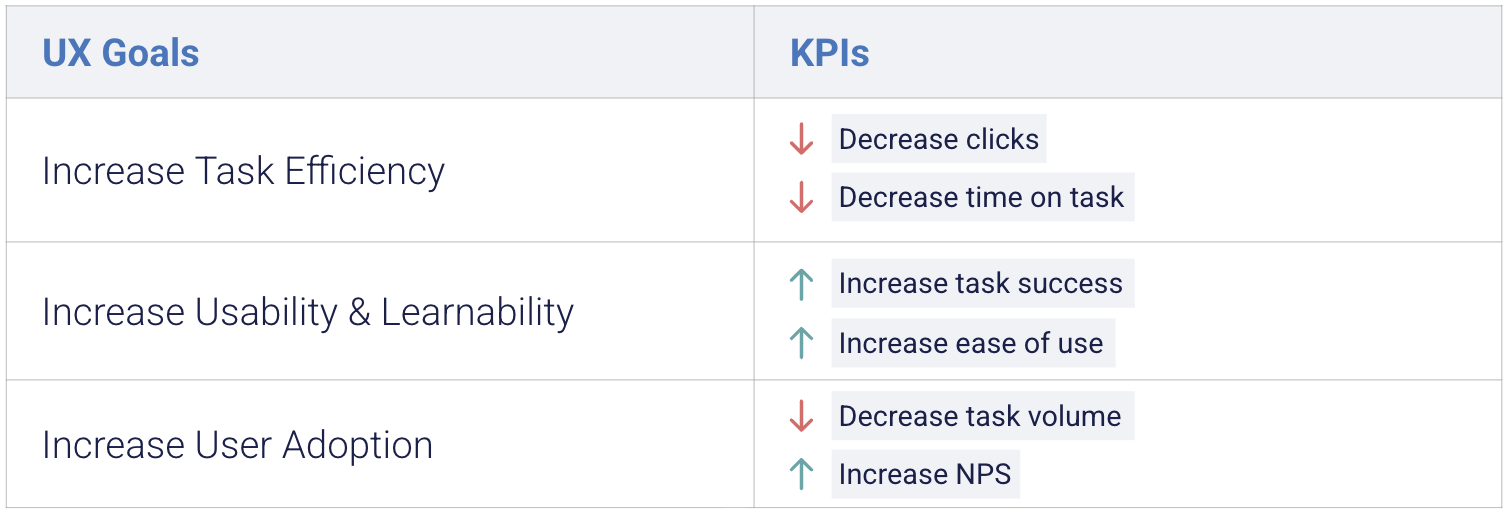
At the outset, we defined success by aligning business goals with user needs. Our UX objectives focused on increasing task efficiency, improving usability and learnability, and ultimately driving user adoption through a more intuitive experience.
We translated these into KPIs: reduced time-on-task, fewer clicks, improved task success rates, and qualitative feedback on ease of use. These benchmarks guided the design process and ensured that every iteration delivered measurable impact for both the user and the business.
Design
Untangling Complexity
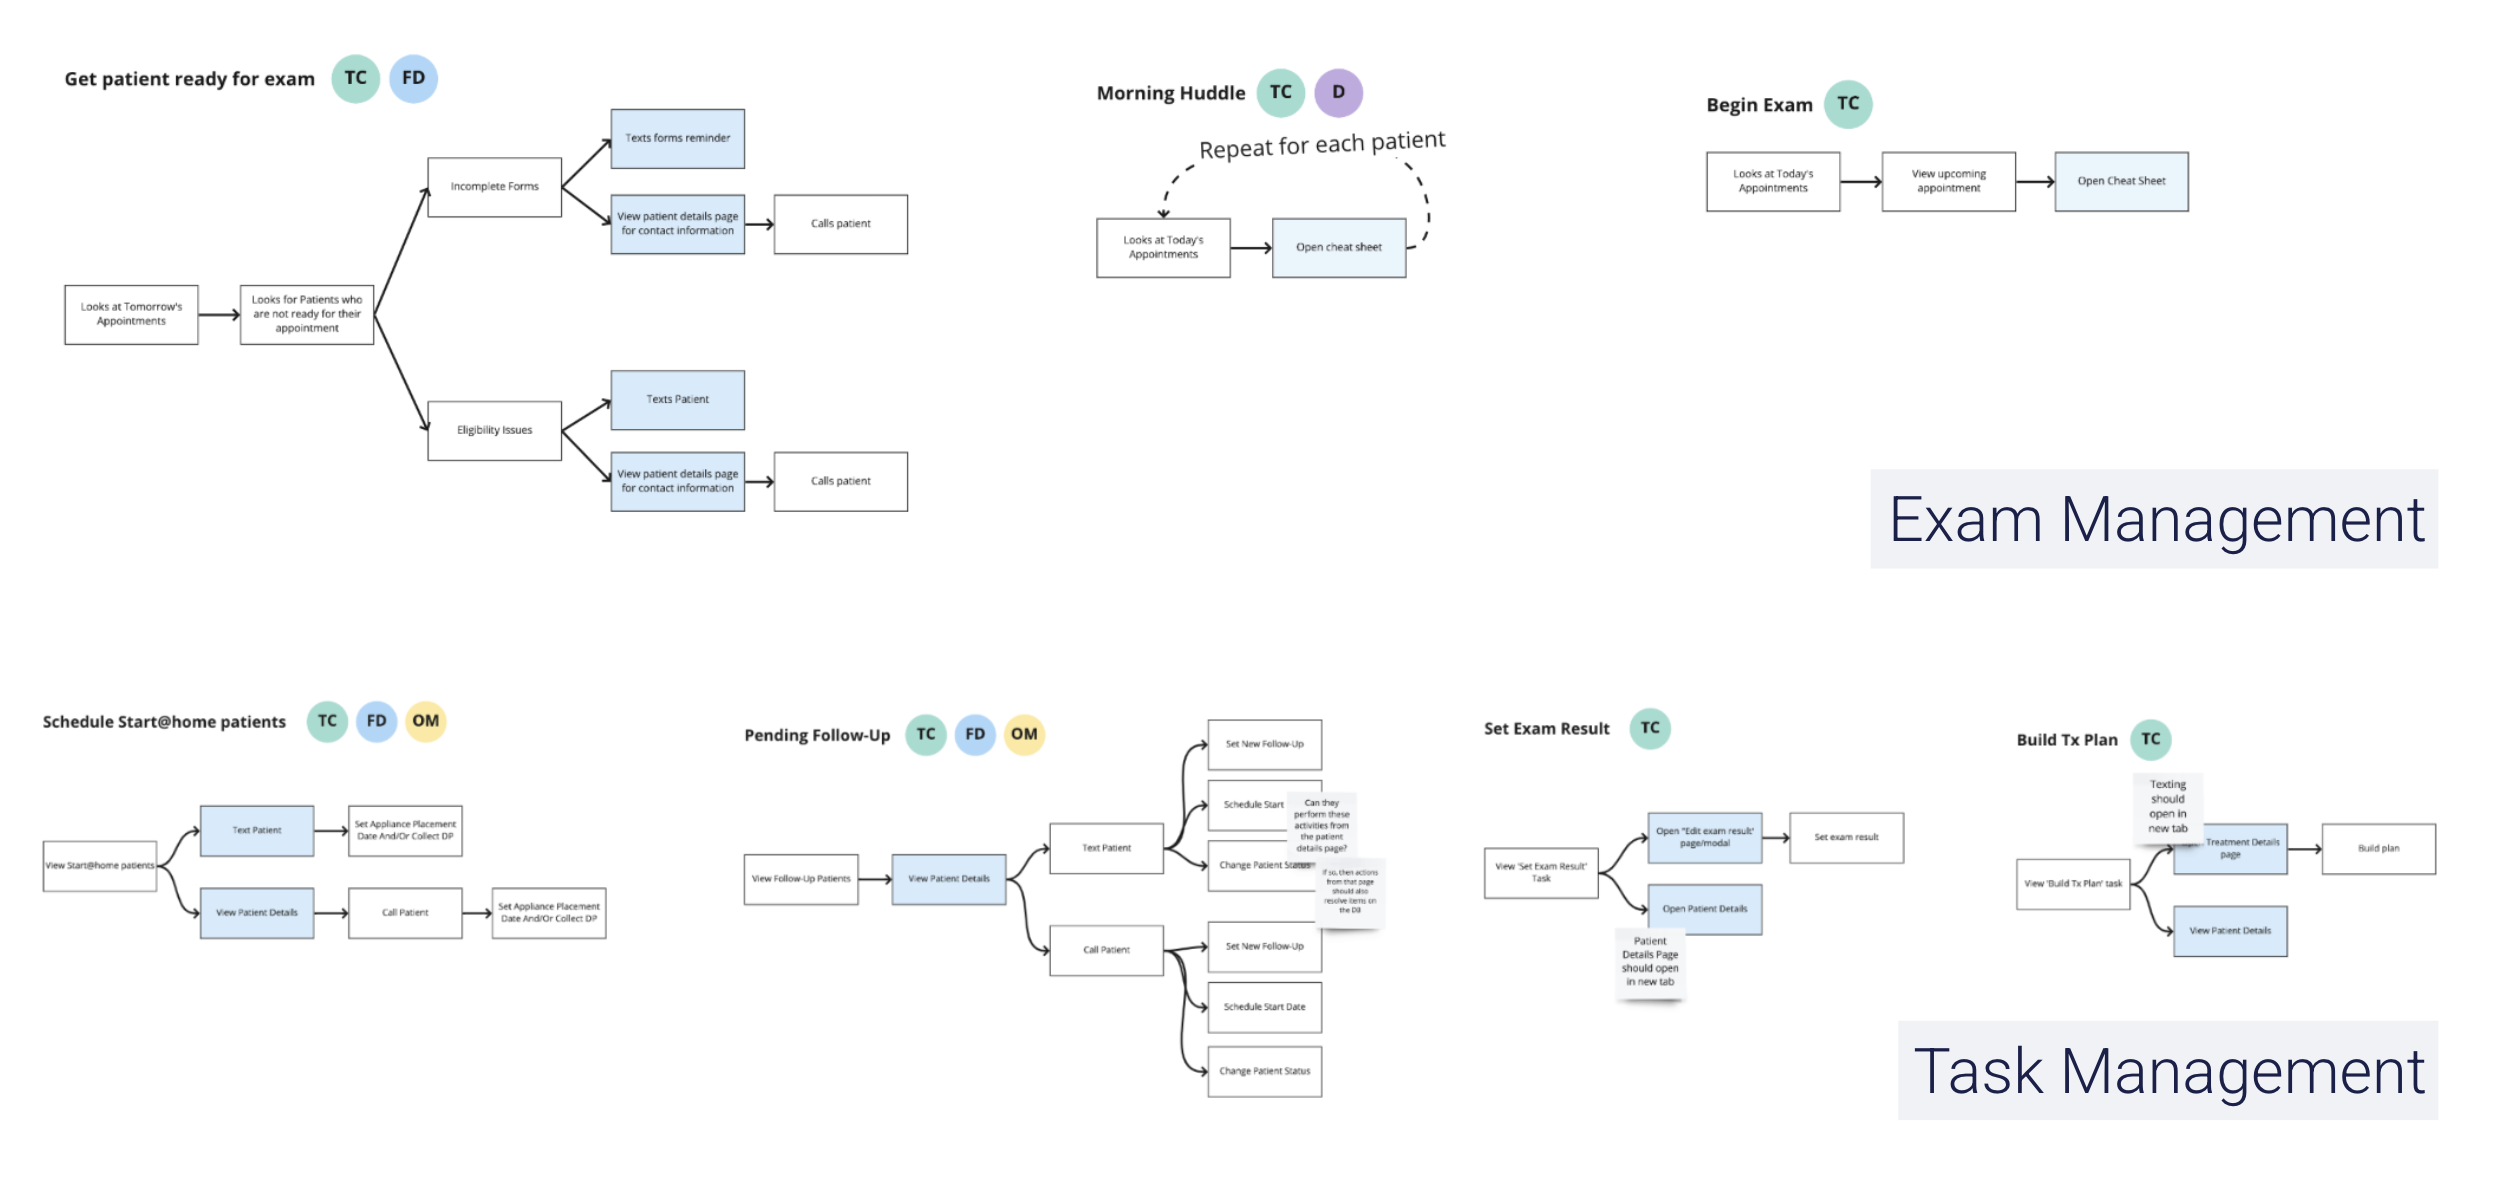
With over 10 years of development, the functionality of the Dashboard was extensive. The first part of the design stage required mapping user journeys and tasks to fully understand the existing functionality and jobs to be done. We identified the following categories of jobs:
Exam Management: New patient forms, insurance verification, scheduling
Task Management: Scheduling follow-ups, managing contracts
This organization allowed me to move into the design phase with a clear understanding of priorities, helping guide content structure, hierarchy, and interactions around the most important user jobs.
Initial Wireframes
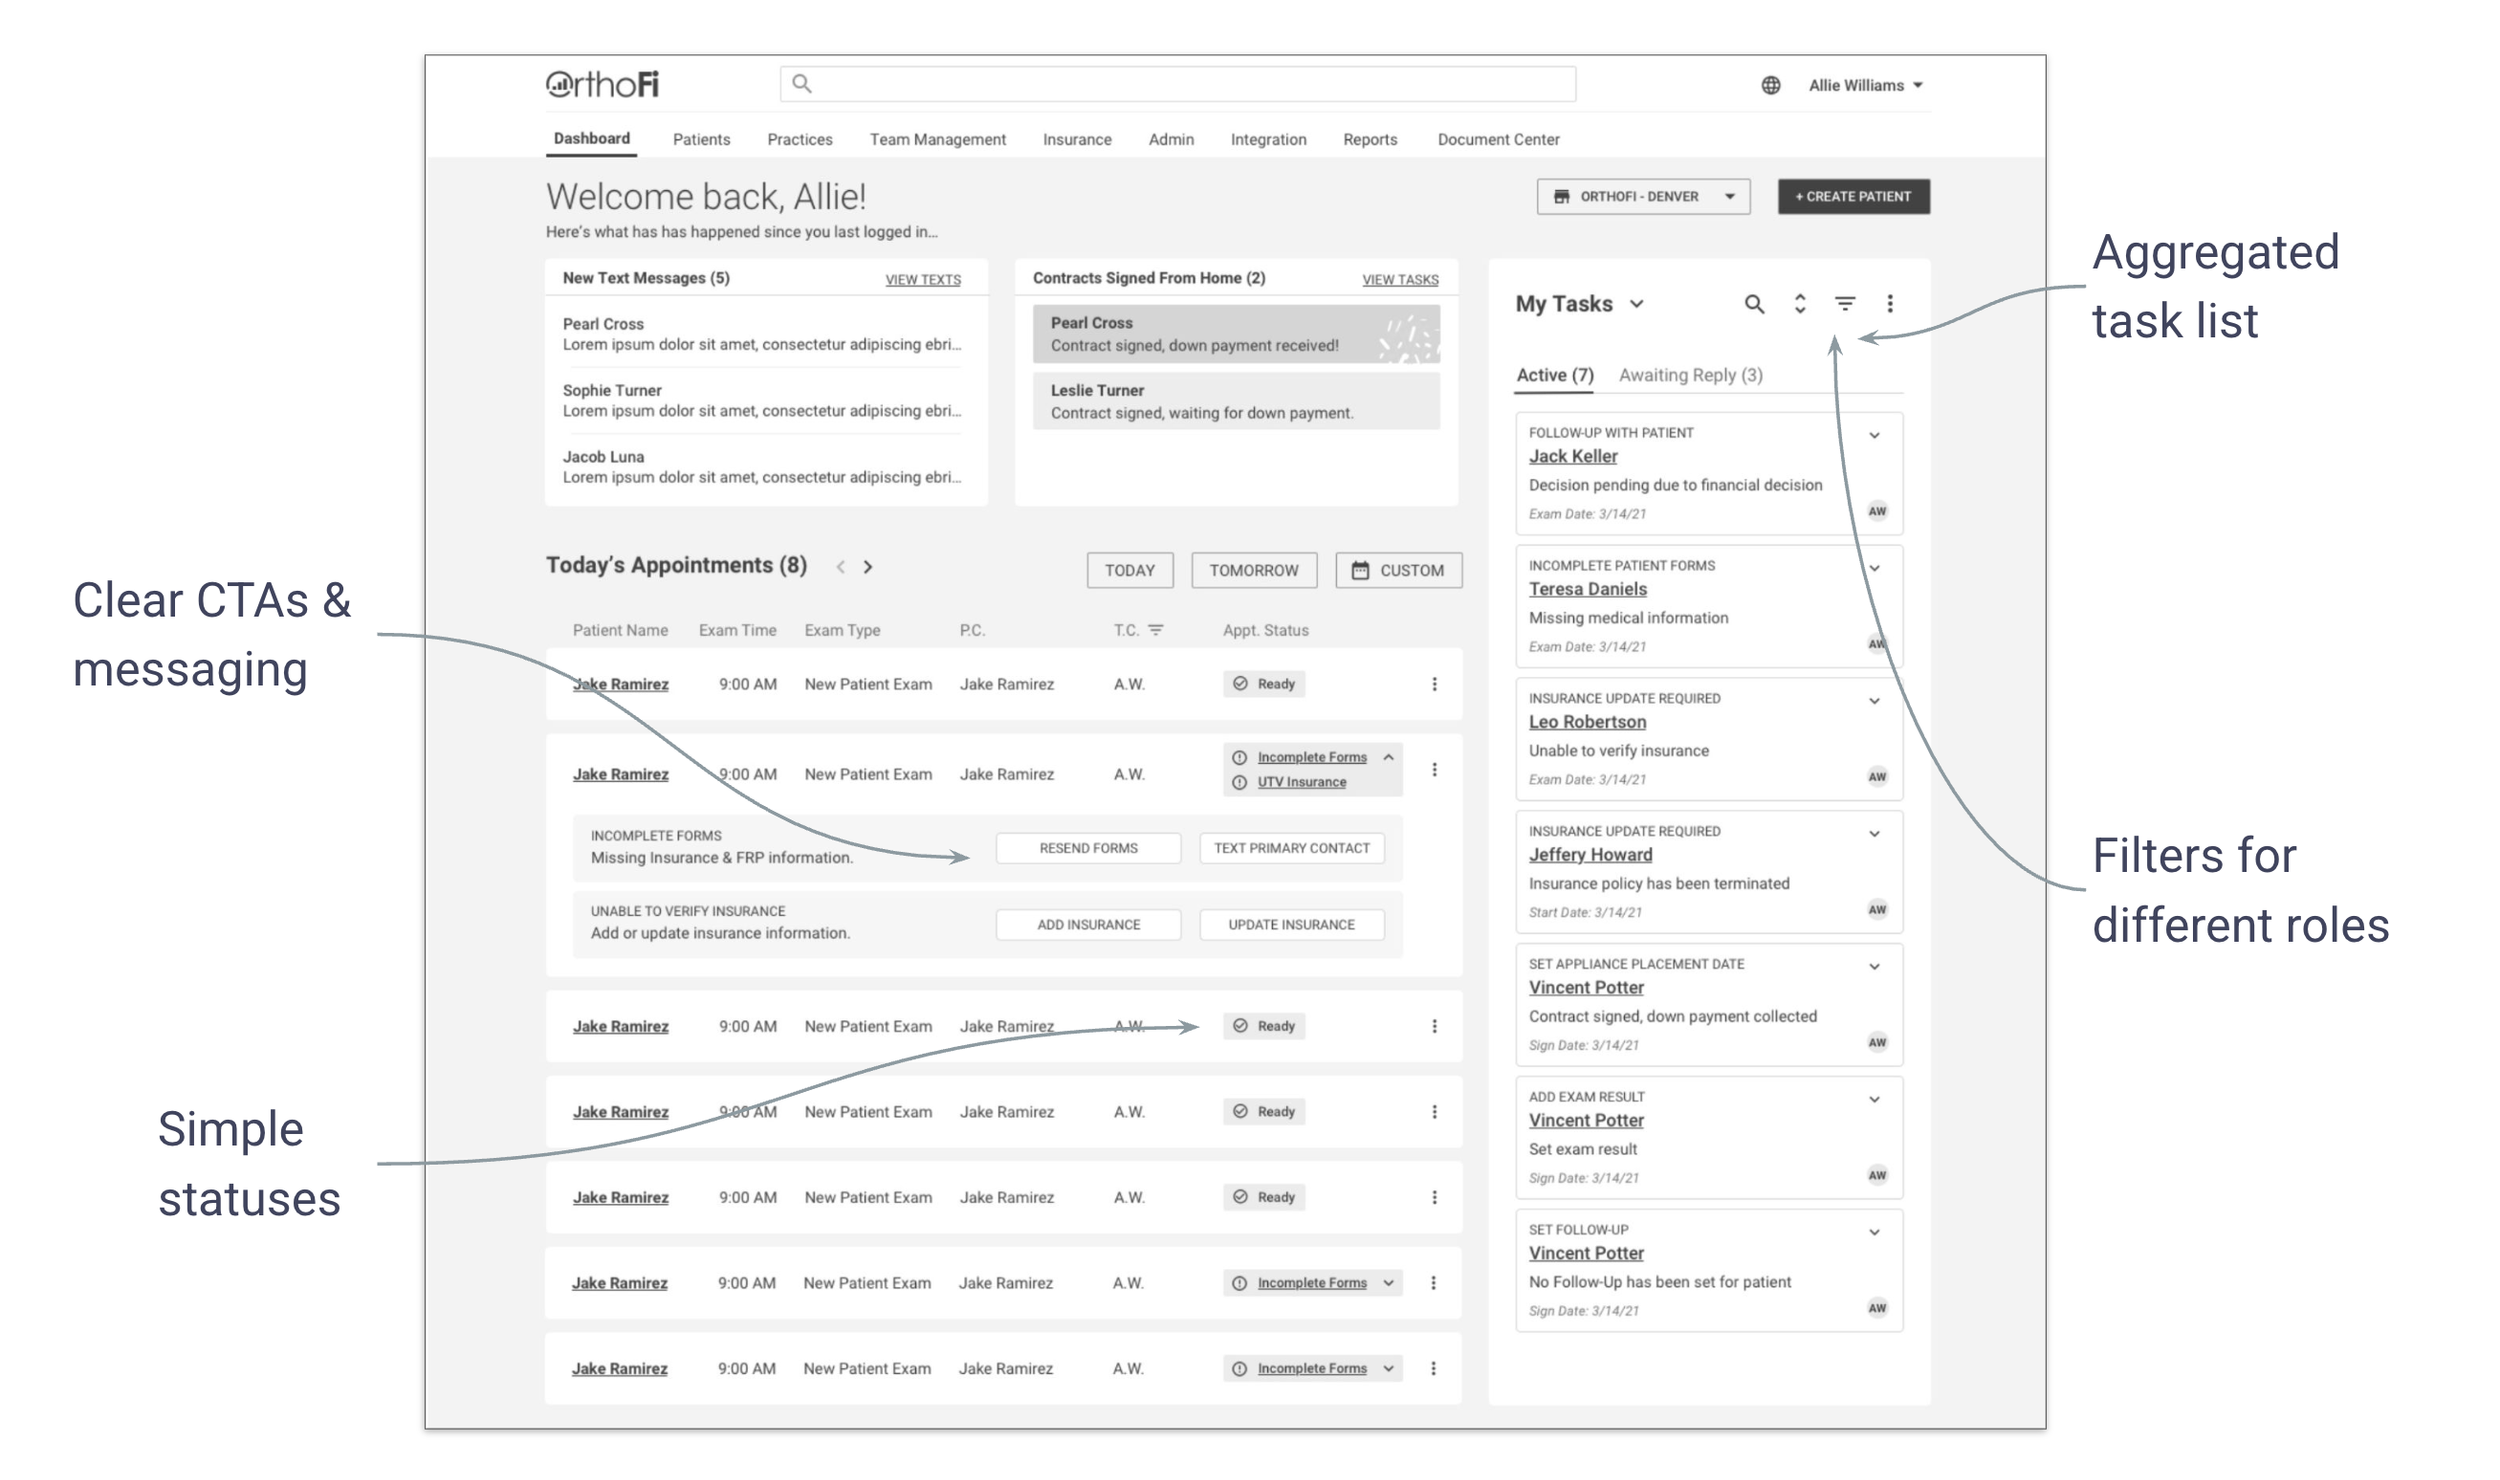
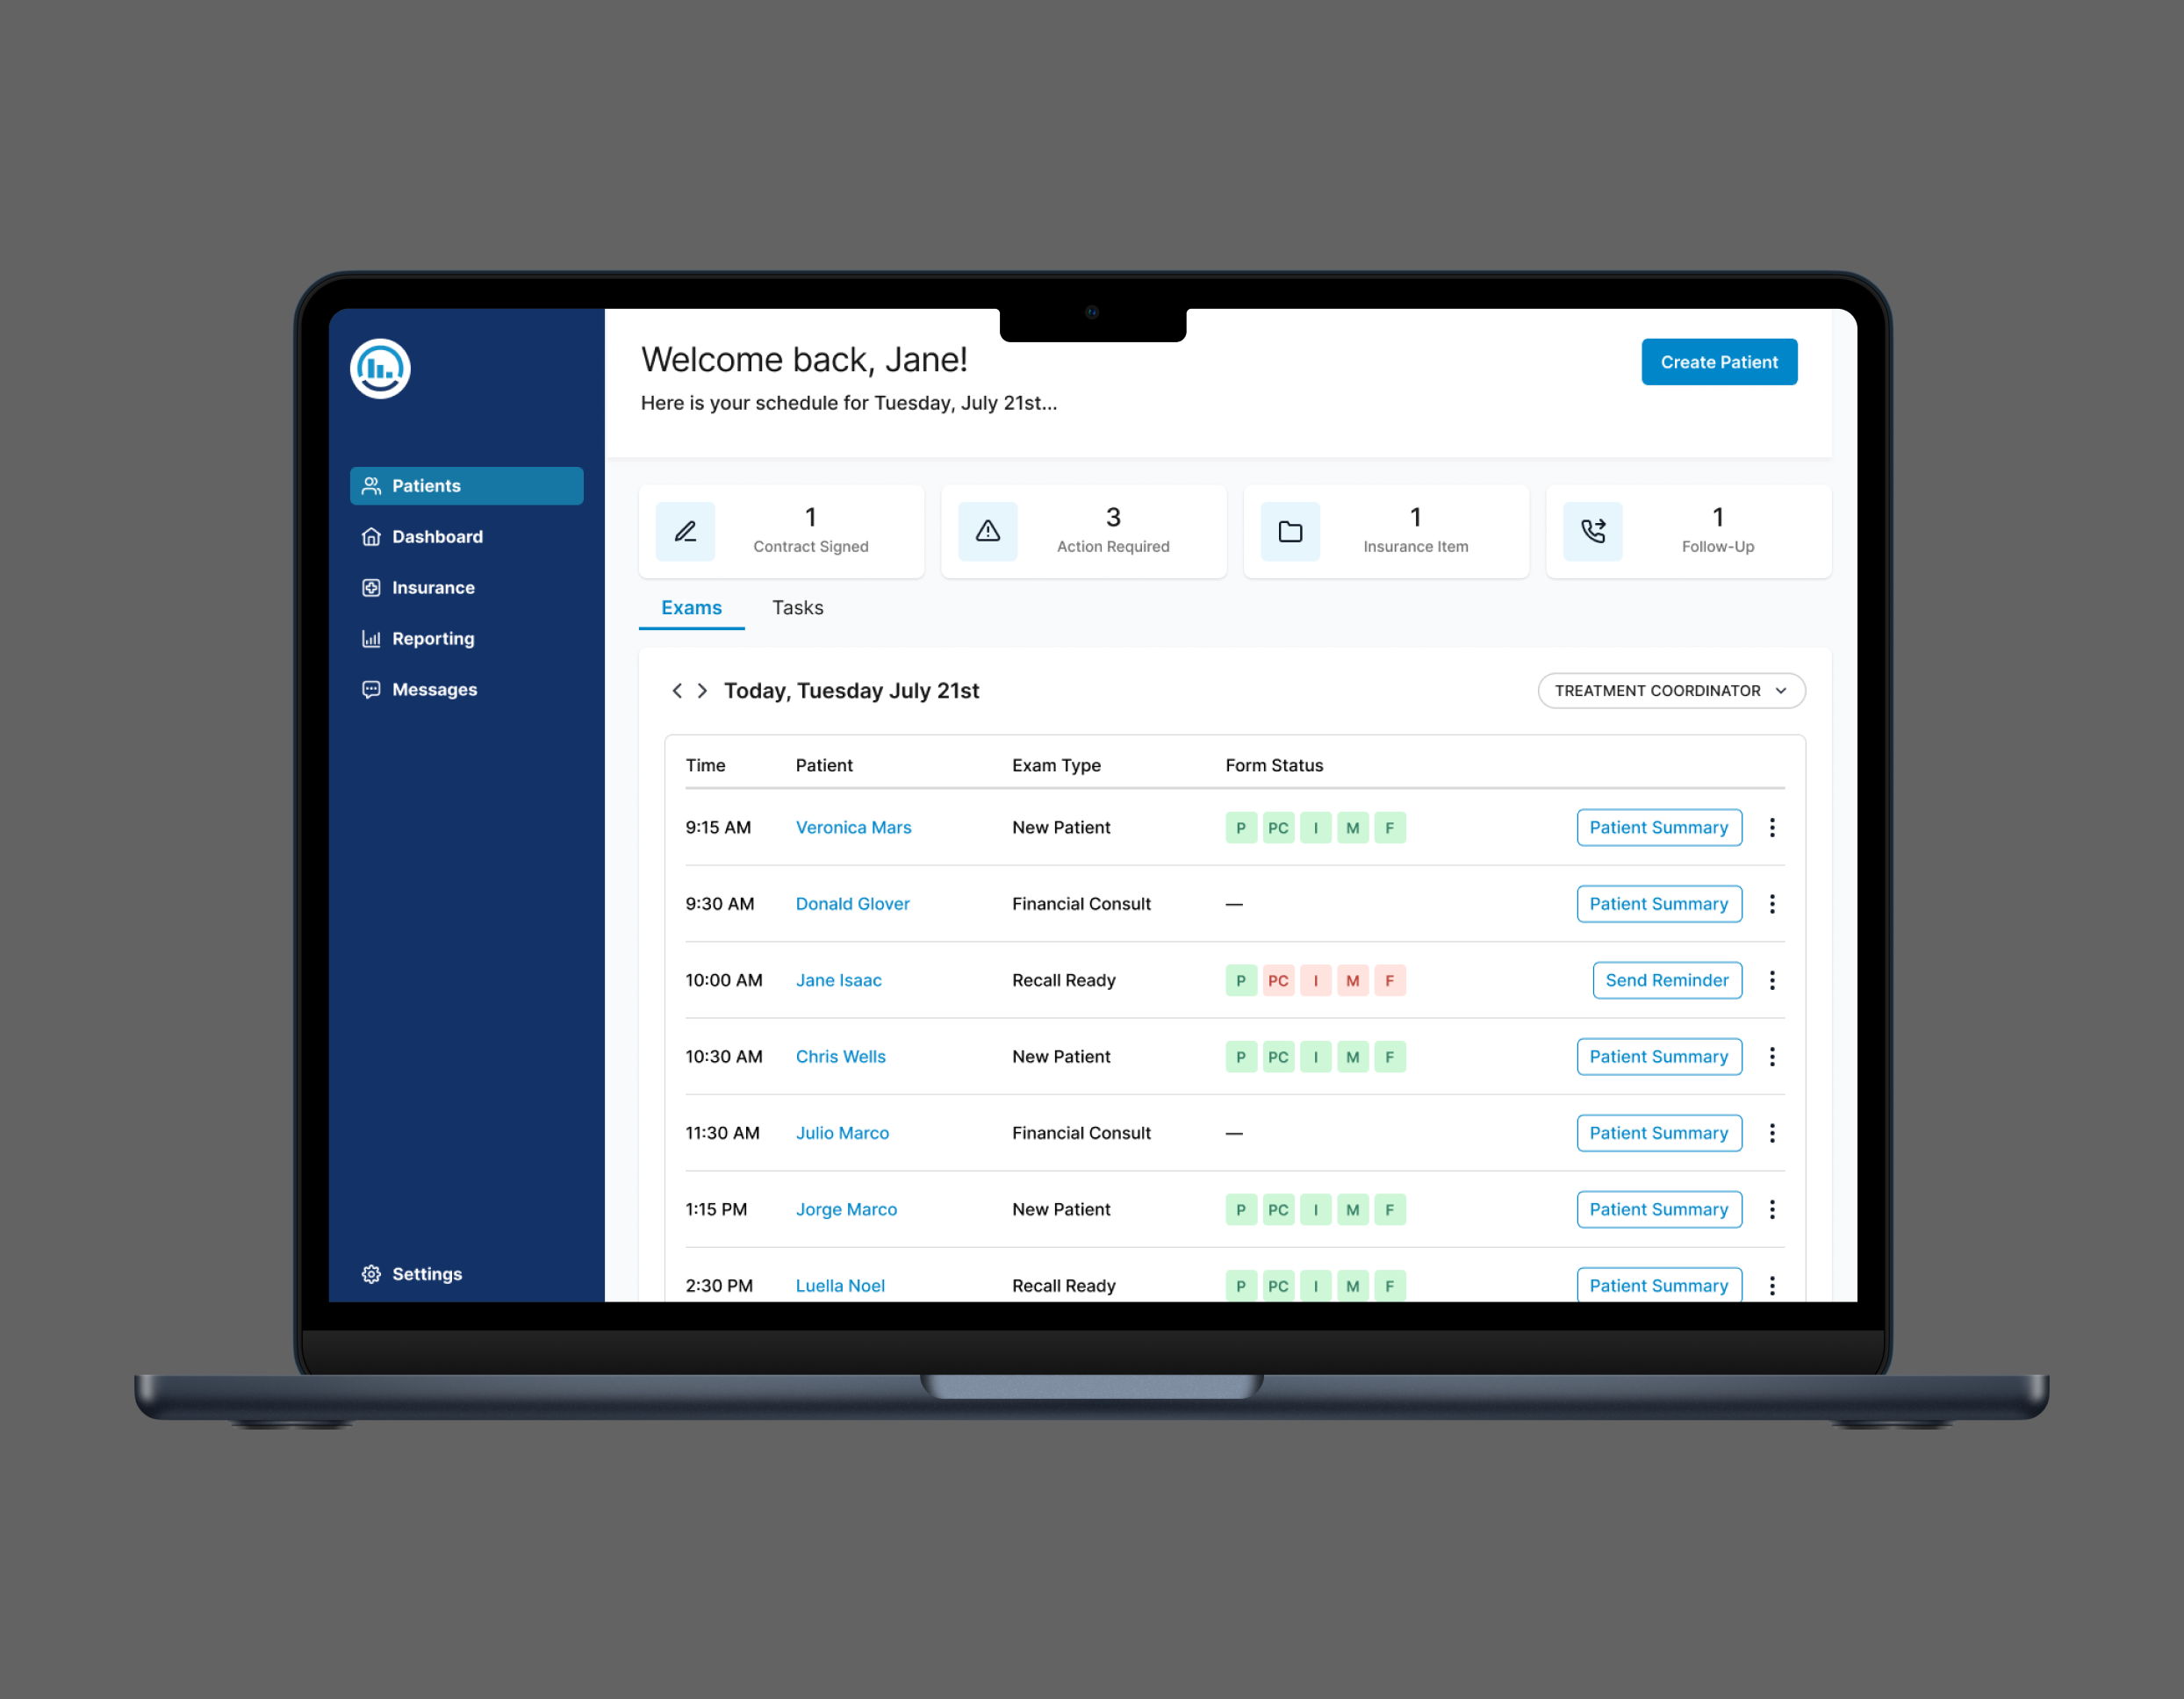
My initial design explored a widget-based approach, separating the dashboard into distinct containers: one focused on Exam Management (e.g., managing upcoming appointments) and the other on Task Management. This modular layout aimed to support the unique workflows of each function. I also experimented with simplifying status indicators, consolidating multiple icons into a more streamlined status badge system to improve visual clarity.
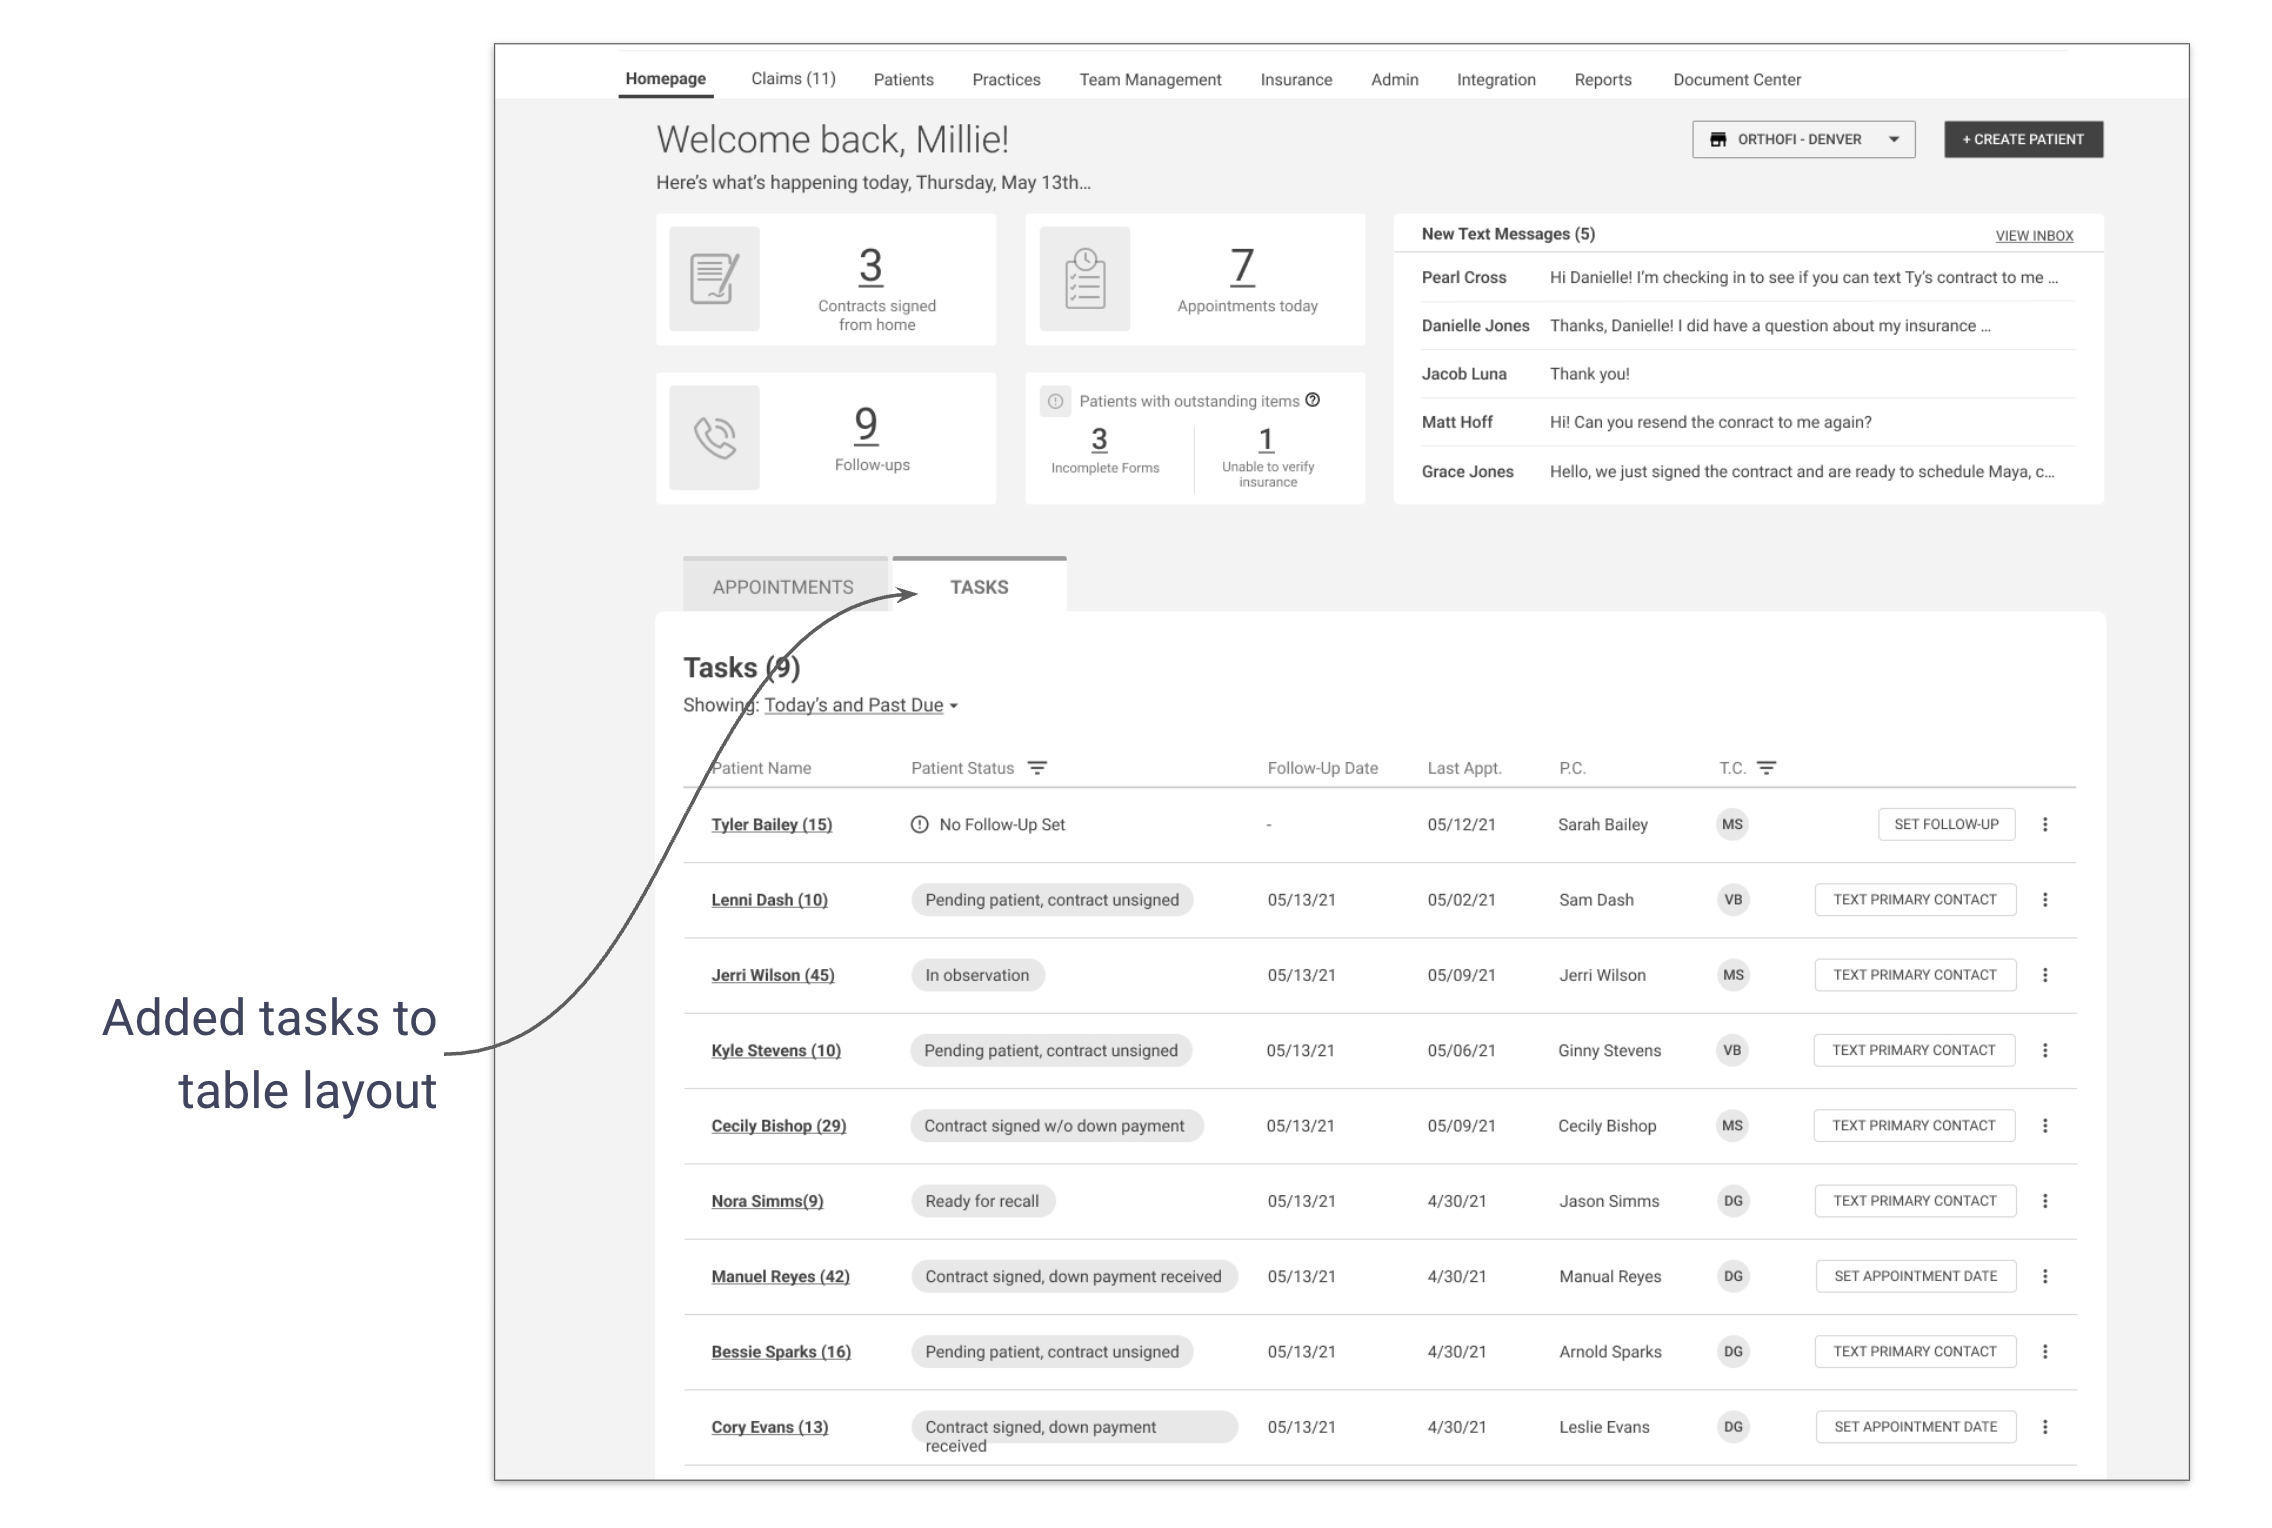
In the second iteration, I shifted to a table-based layout after identifying significant overlap between appointment and task metadata. Both types of information shared similar attributes (e.g., statuses, actions, timestamps), which made it more intuitive and technically efficient to display them within a unified table. This structure allowed for sorting and filtering across all items and helped reduce visual and cognitive complexity for the user.
Testing Assumptions
“I love the improvements! I’m getting a lot more info now instead of having to go into each tab.”
Usability Test
To test the new designs, I created a high-fidelity prototype and conducted usability tests with 12 practice staff participants. We learned that users…
Did not like the new status structure and preferred the old icons
Liked having all their tasks grouped together in one area
Were more successful understanding tasks and actions on the new dashboard
Made sense of the new Dashboard by looking for what was familiar
A/B Testing
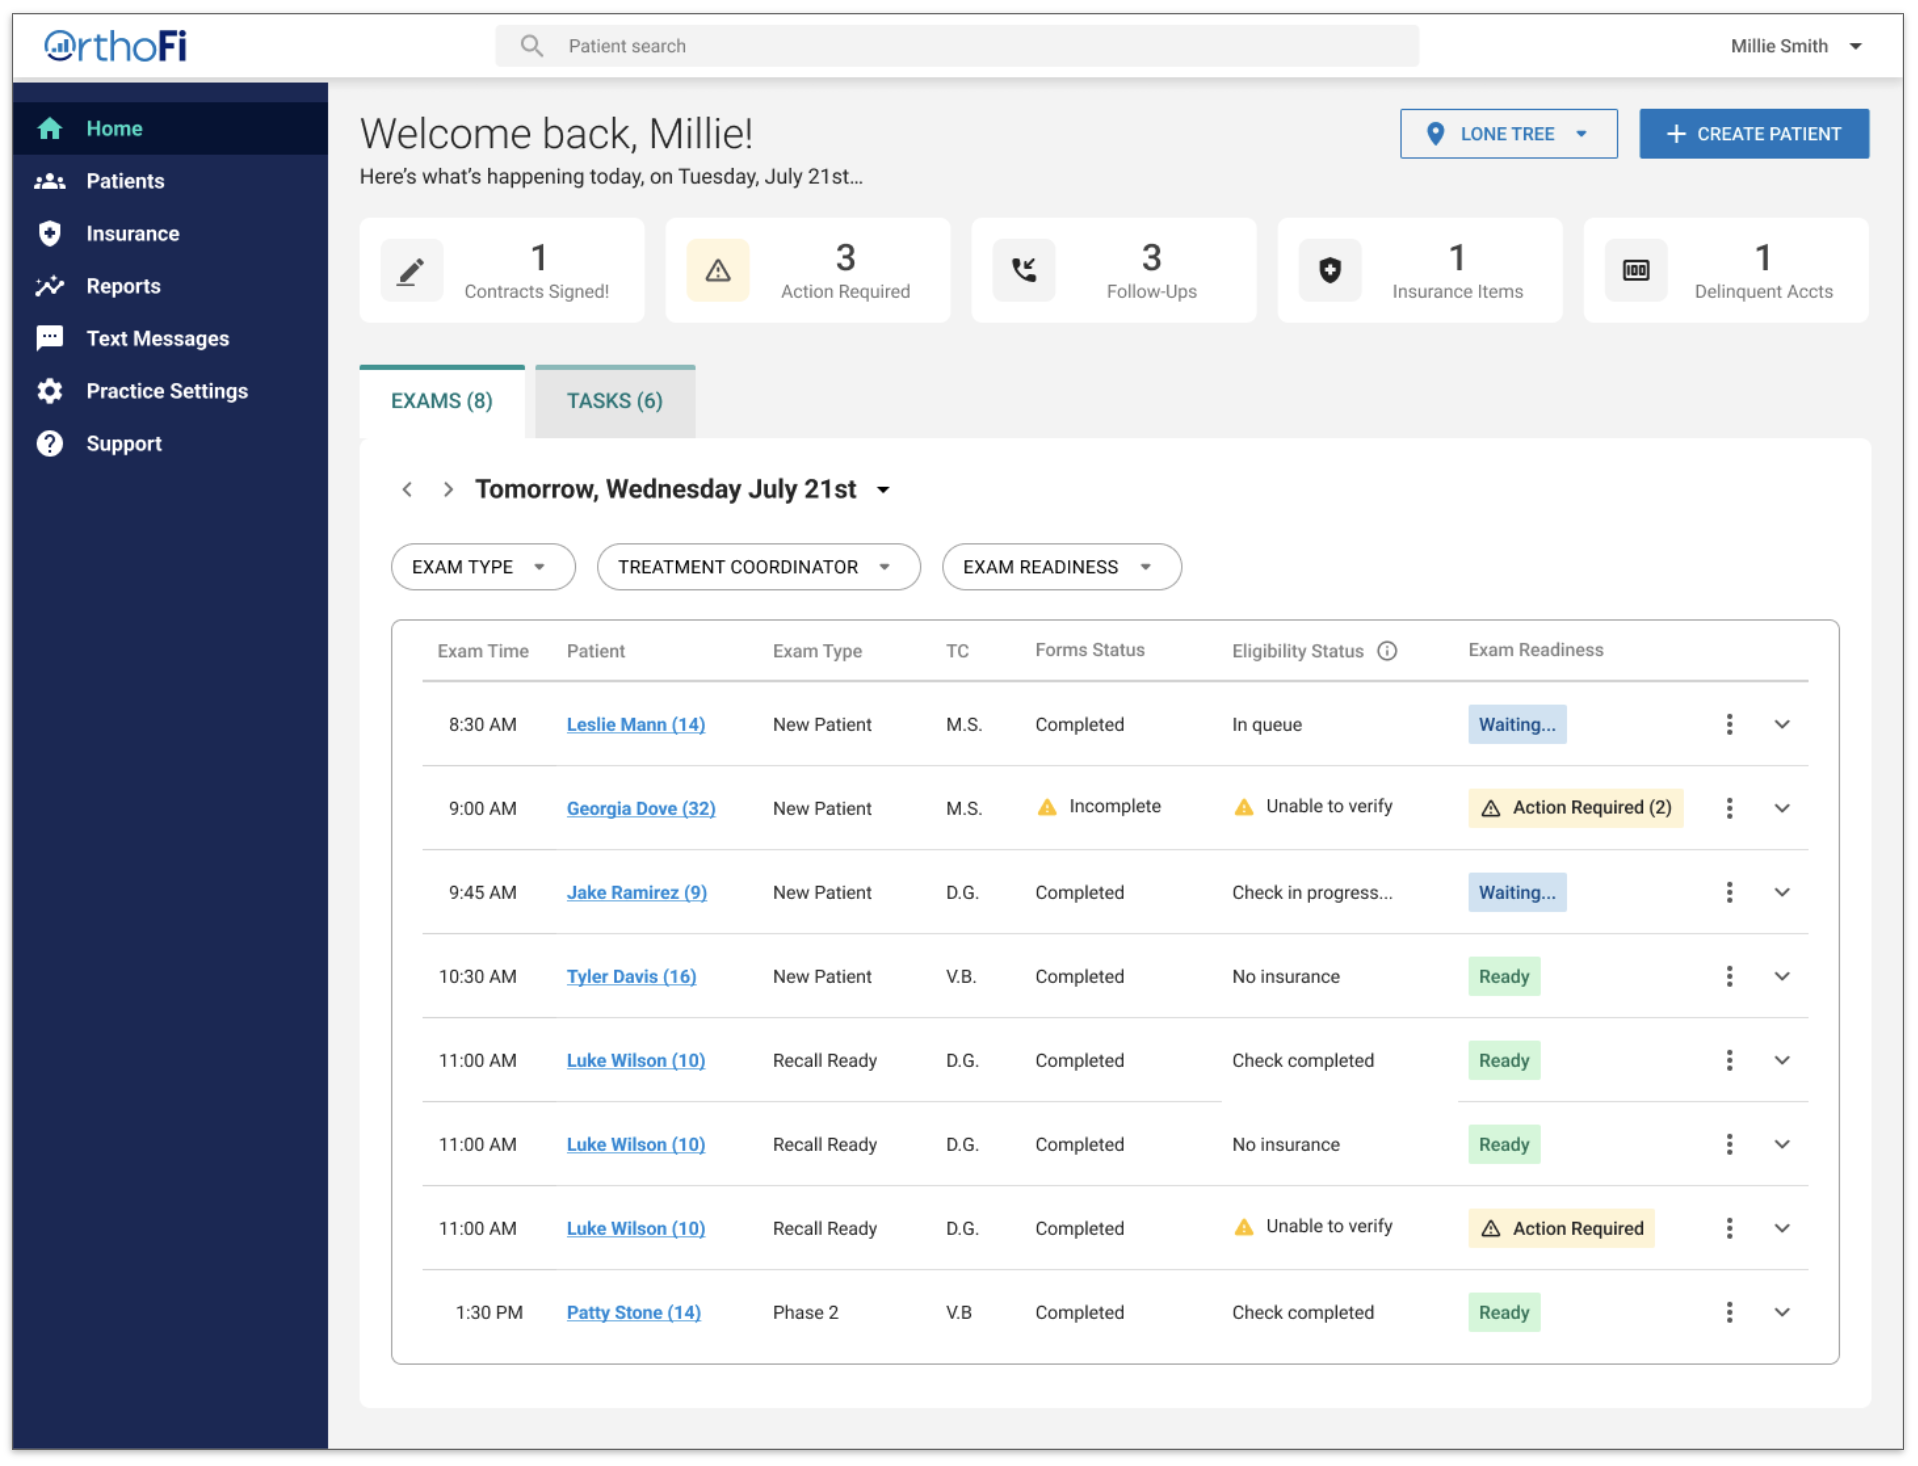
Knowing it was a tricky balance between disrupting familiarity for existing users and simplifying the experience with new patterns, I had to be intentional about where to push and where to retain elements of the current system. Since the simplified status structure emerged as a major pain point, I revisited the initial design patterns and iterated on a version that preserved familiar iconography while still supporting the broader goal of clarity and usability.
To evaluate the design iterations from the first round of testing, overall impact of our design updates, and measure against project KPIs, we conducted 10 remote, unmoderated A/B tests. Participants interacted with both the legacy and redesigned dashboards, completing key tasks and providing feedback. This allowed us to compare usability, task success, and overall experience across both versions.
Results
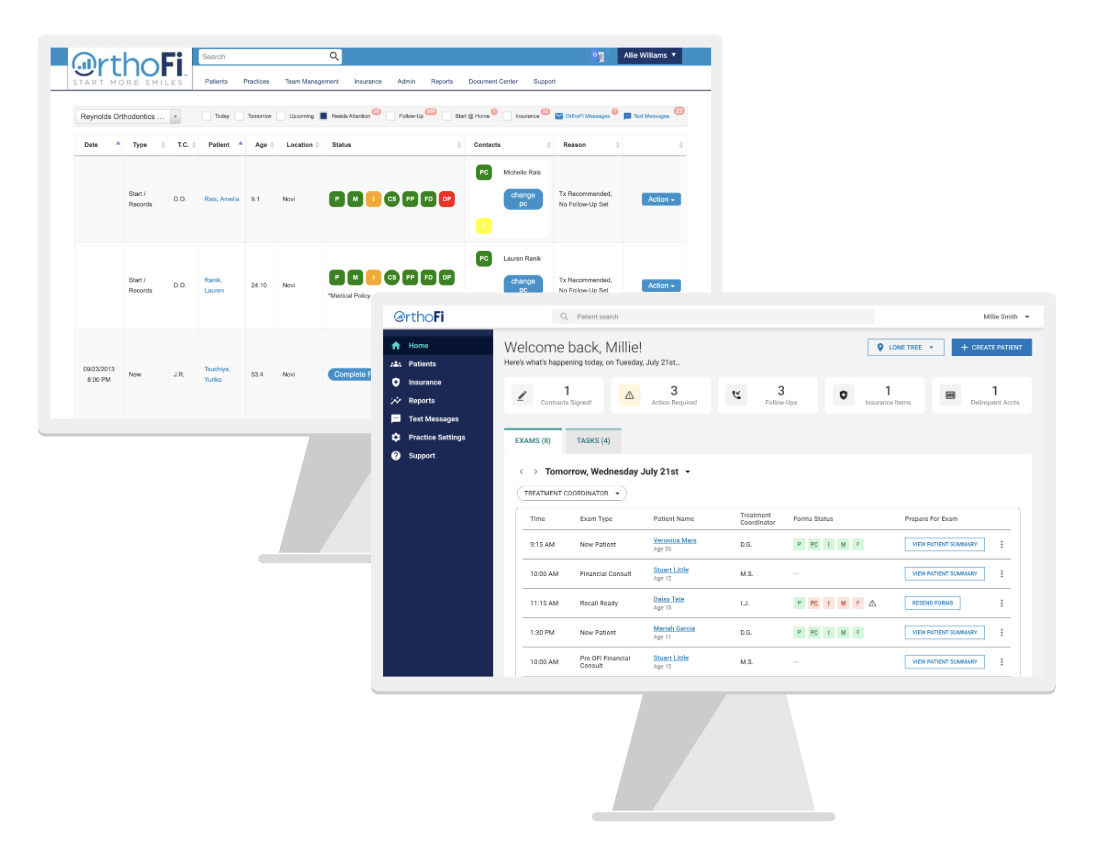
Users overwhelmingly preferred the new dashboard to the legacy version and we improved both task efficiency and usability and learnability.
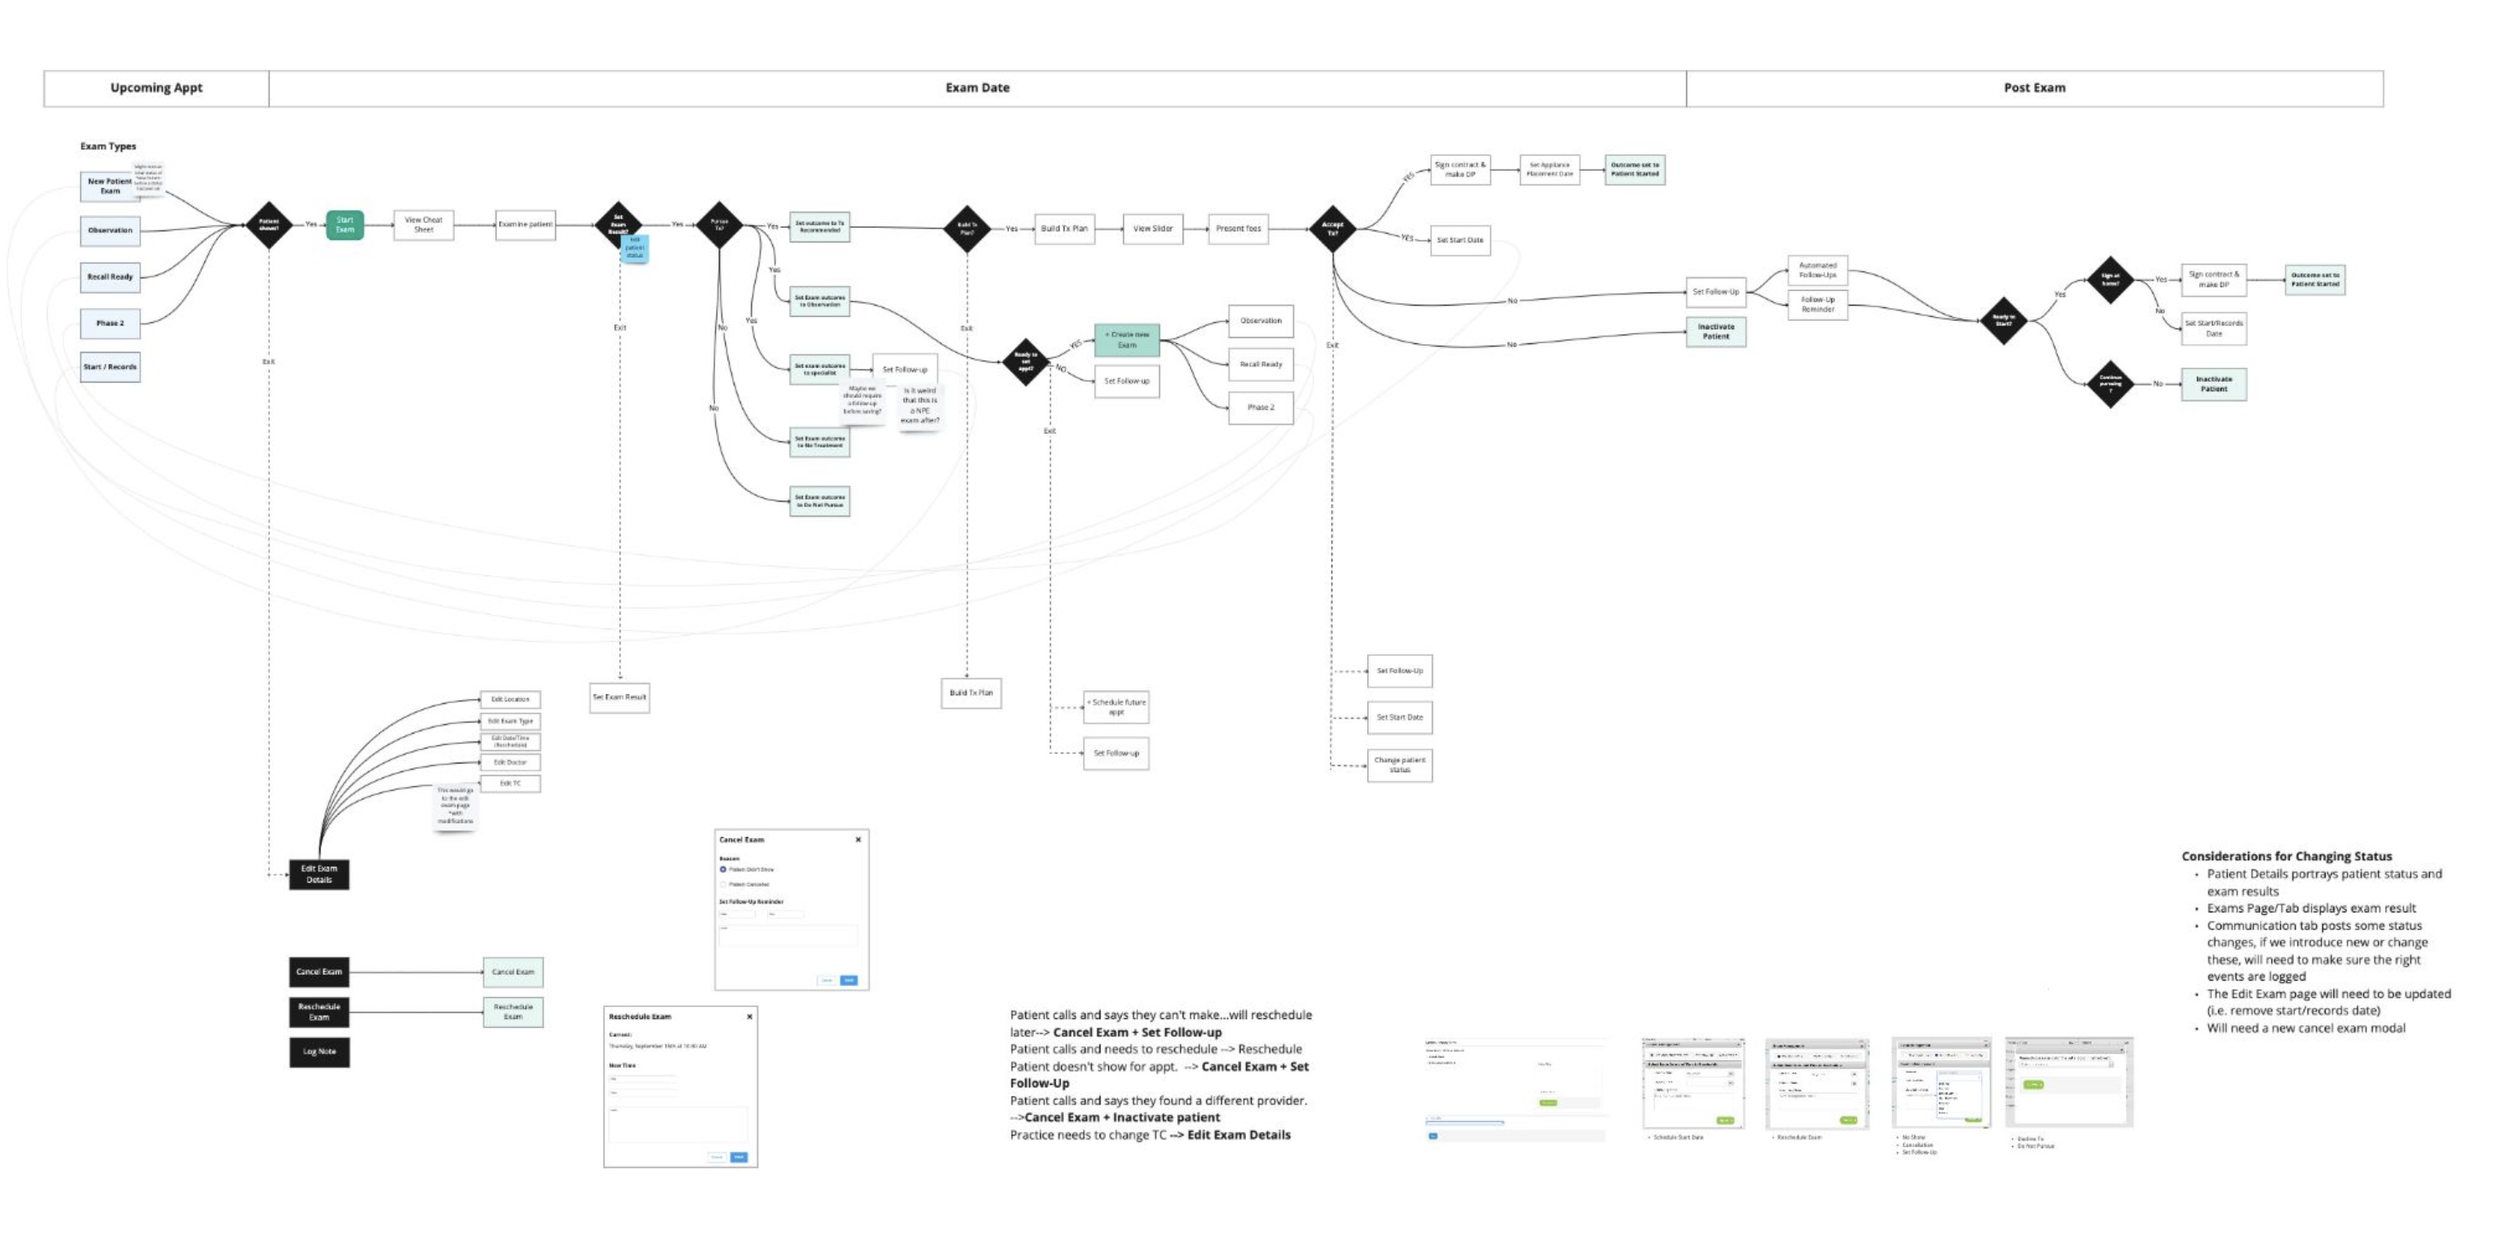
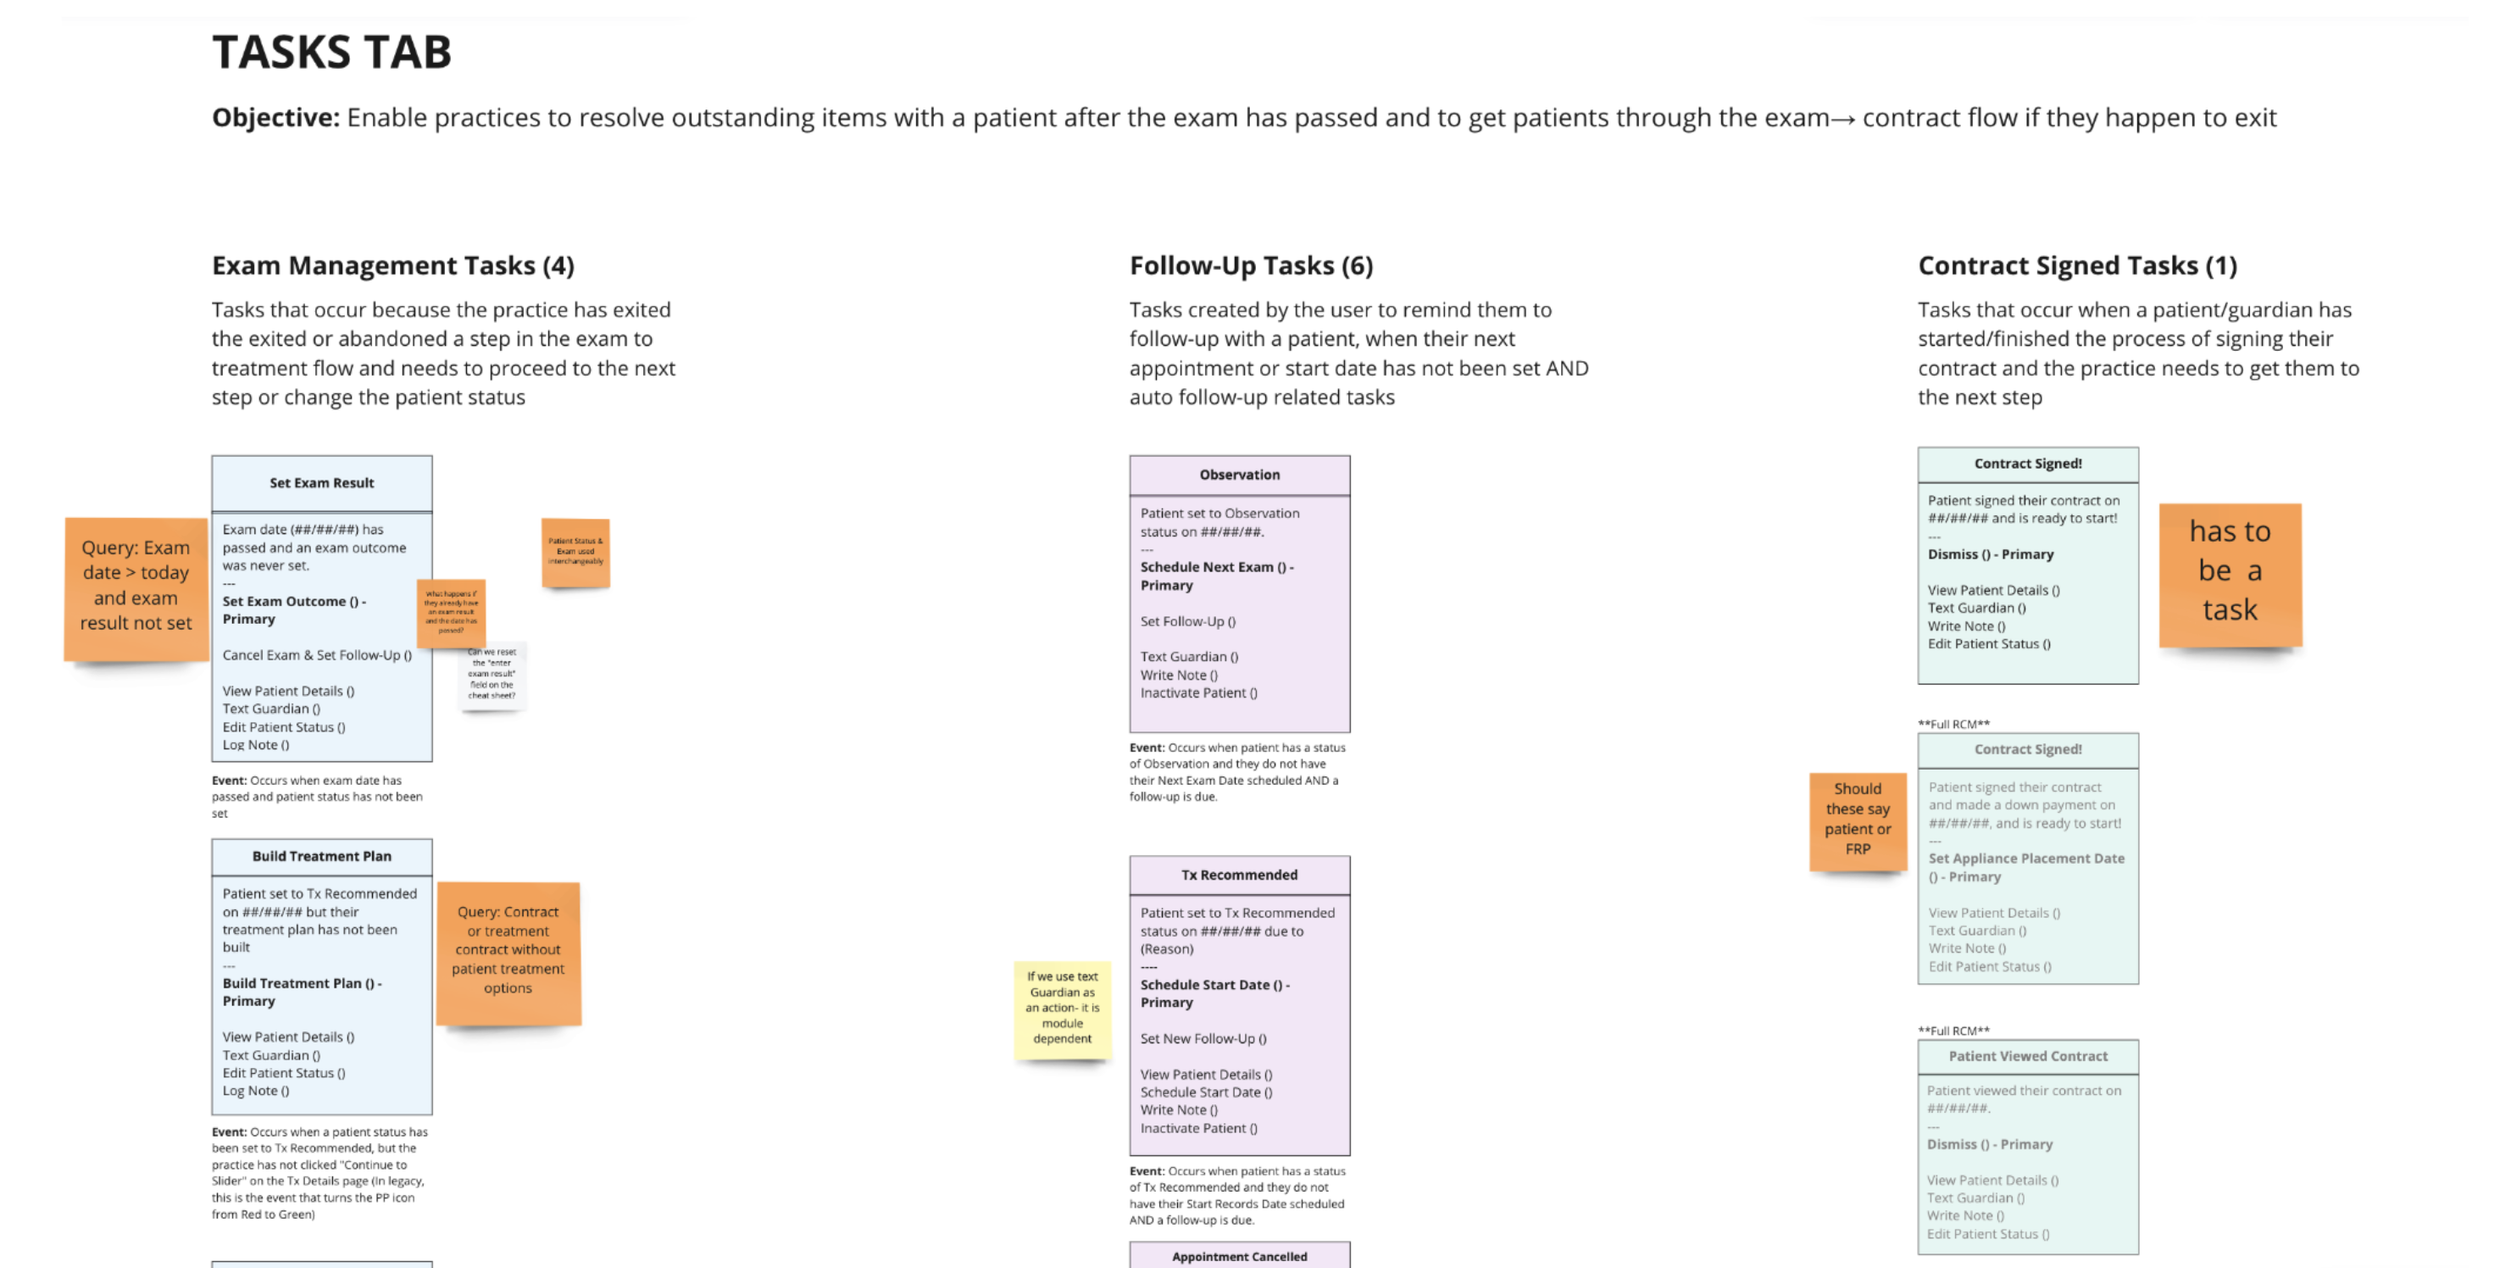
Business Logic
As a final deliverable of the project, I mapped the end-to-end system journey, uncovering how business logic drove task visibility. This included when tasks appeared, what triggered their states, and how completion was measured. These flows were critical in aligning UX with dev and ensuring they had a solid understanding of the new dashboard and validating technical feasibility.
Final Reflections
Start complexity sooner: Address business logic and technical constraints earlier in the process
MVP is not minimal: Focus on what’s essential to support cross-role functionality
Design for transition: Users rely on familiar patterns when adapting to change — a critical insight for product adoption
The redesign led to measurable improvements in usability and efficiency. Tasks were completed faster, users reported increased satisfaction, and the system was easier to onboard new users into. While adoption metrics were still pending at the time of final testing, internal stakeholder response was overwhelmingly positive and the dashboard was moved forward into development.